

A chart spikes, and suddenly a product looks like the next big opportunity. Before changing your content calendar or buying inventory, ask what the chart actually measures. Search interest is useful evidence, but it is not a purchase order.
Google Trends for market research helps you compare how interest changes across time and geography. Its newer Gemini-assisted exploration can broaden the questions you investigate. The value comes from using those suggestions carefully and checking them against the business decision you need to make.
Understand the number before interpreting the line
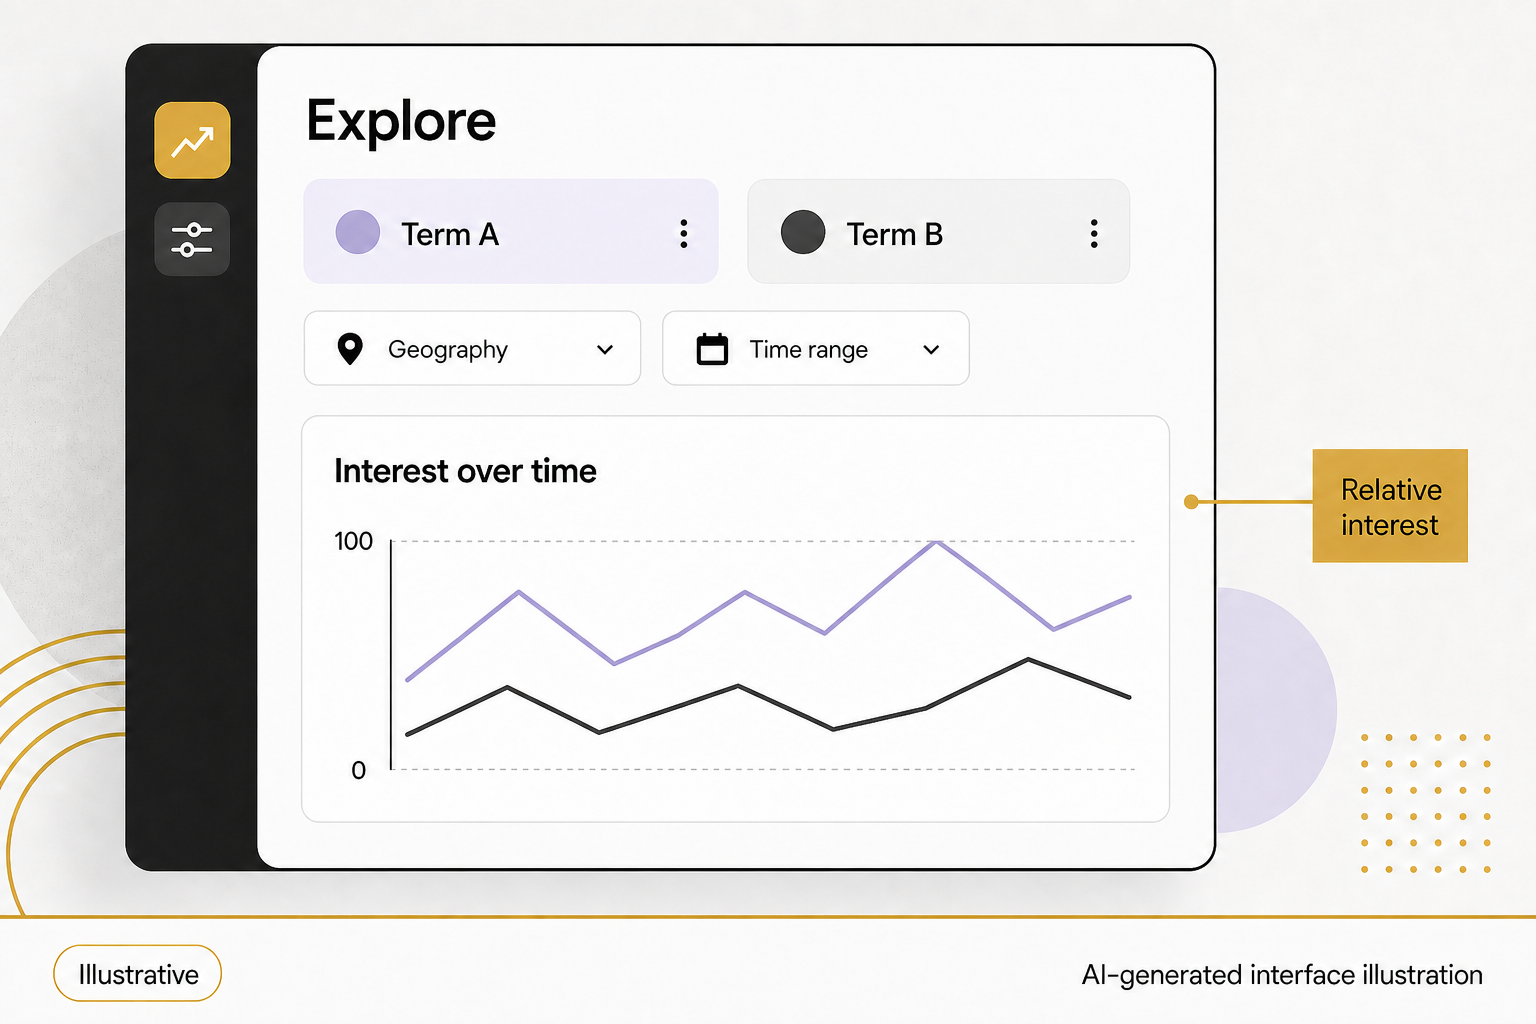
Google explains that Trends uses sampled data and normalizes interest on a scale from 0 to 100. A score of 100 marks the peak within the chosen comparison, not a count of searches. Equal scores across regions do not imply equal numbers of potential customers.
That distinction changes the questions you can answer. Trends can help investigate seasonality or compare relative interest. It cannot directly establish revenue, market share or the number of people ready to buy your service.
Do not paste a chart into an AI tool and ask it to calculate sales potential without additional evidence. A precise-looking estimate built on the wrong unit is still wrong.
Start with a decision and a short hypothesis
Write what you are trying to learn. For example: Does interest in patio furniture tend to build before our usual spring campaign? That is narrower and more useful than asking what is trending.
Choose terms that match the decision. Compare related products, questions or service language. When selecting between a search term and a topic, inspect what the choice represents rather than assuming they are interchangeable.
Record the time range, geography, category and search type. These settings are part of the result. A screenshot without them makes the research difficult to reproduce and easy to misinterpret later.
Use Gemini to expand the research set
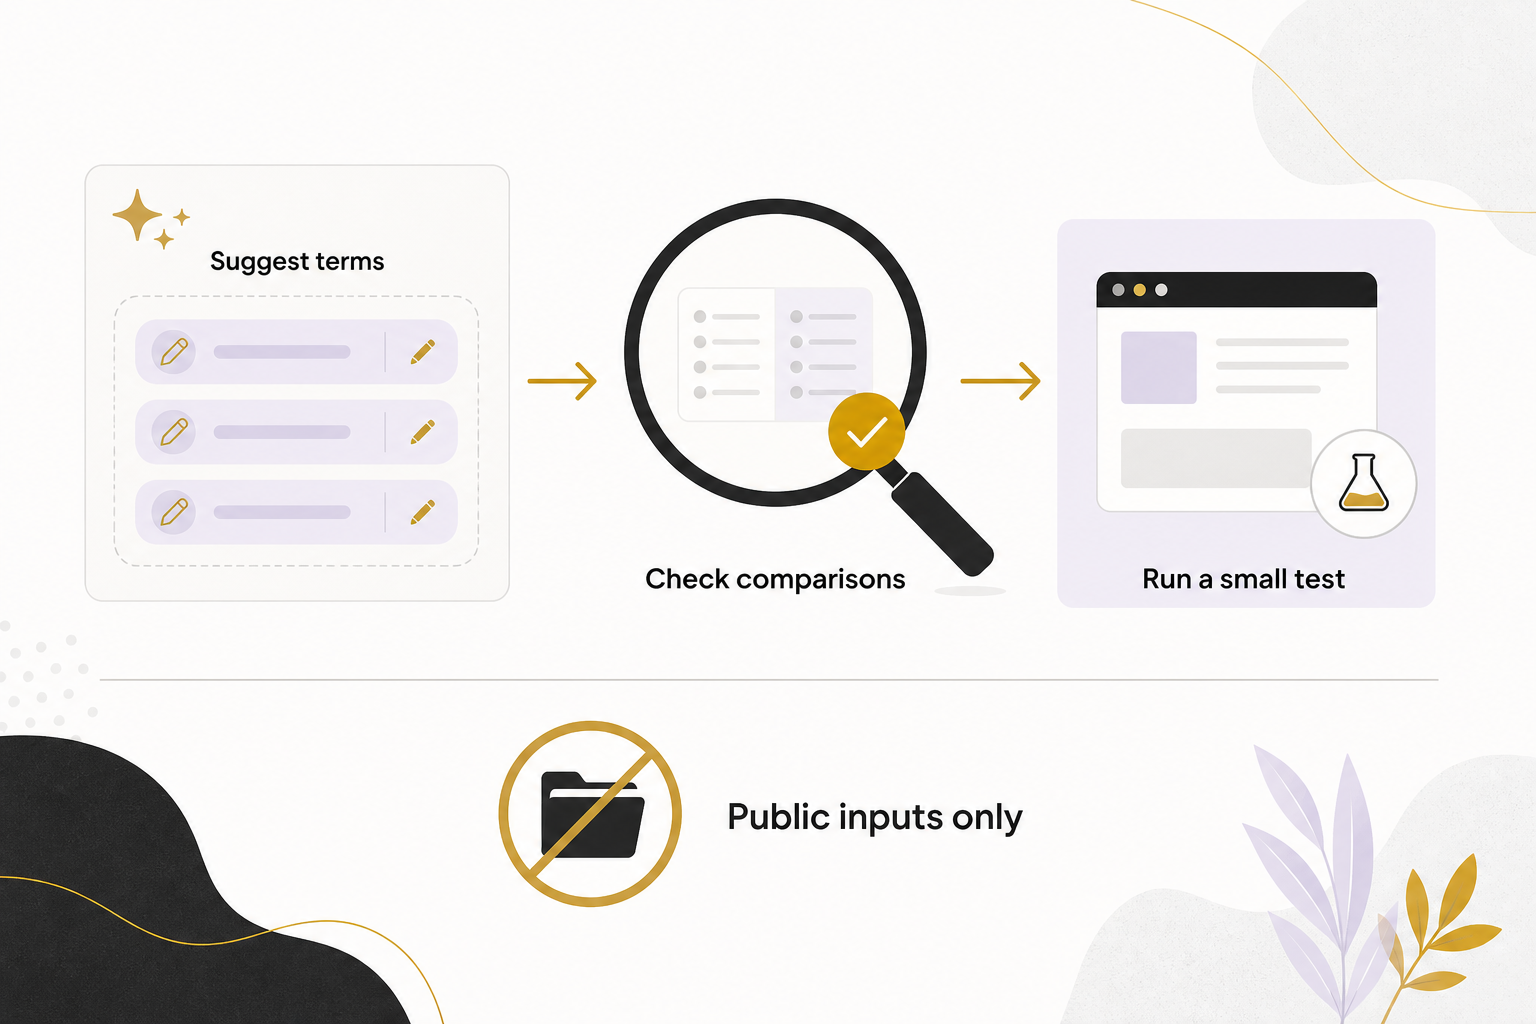
Google’s Explore documentation describes experimental Gemini suggestions that generate related terms and comparisons from a prompt. Google also warns that the feature can be inaccurate.
Keep confidential plans, customer records and personal information out of Gemini prompts. The same guidance explains that interactions can undergo human review and support product improvement.
Use it to suggest questions you might overlook, then inspect the actual terms. A model can group a product, a brand and a news event into a plausible list even when they represent different customer intentions. Remove comparisons that do not answer your question.
A useful prompt describes the market and decision: “Suggest terms to compare early planning versus ready-to-buy interest for outdoor furniture.” The output is a candidate research list, not proof that those phrases have commercial value.
Compare enough history to recognize seasonality
Inspect a longer period before reacting to the latest movement. Look for repeated patterns, unusual events and changes that persist. Then narrow the period to examine the timing of a relevant shift.
Use the same settings when comparing options. If you change the geography or time window, the scale may change too. Do not splice separately normalized charts together as though they were one continuous measurement.
Low-volume local or specialized terms may provide little usable data. Widening the region or using a broader topic can help investigate context, but label the change. National interest does not become local evidence merely because local data was sparse.
Read the related questions before planning content
Related queries can reveal the language people use and the issues connected to a topic. Open the actual search results and assess intent. A surge may reflect a recall, celebrity story or controversy rather than a new pool of willing buyers.
Separate educational questions from shopping questions. An article explaining materials may support early evaluation; a category page should help someone compare available products. Avoid publishing a thin article for every phrase in a generated list.
Keep notes on why a topic belongs in the plan, which audience it serves and what reliable information the business can contribute.
Turn the observation into a small test
Consider a hypothetical outdoor retailer comparing interest in patio umbrellas and replacement canopies. If repeated seasonal patterns suggest earlier planning, it could prepare a fit-and-measure guide ahead of that period. The chart alone would not justify ordering more inventory.
Check the hypothesis against actual customer questions, product availability, Search Console queries and sales records. A promising search pattern may have little relevance to the products you carry or locations you serve.
Test the content timing, record what changed and review meaningful visits and inquiries. Keep results separate from the original hypothesis so the research does not become a story that always confirms itself.
Save a research note someone else can verify
Include the decision, comparison settings, date checked, observation, alternative explanations and next test. AI can organize that note, but you should verify every claimed pattern against the chart. The best output is a better-informed decision, not a dramatic graph.
To connect search research with a practical content plan, book a discovery call with Eastmoor Digital.
Sources & further reading
Primary references checked for this refresh. Availability and platform behavior may change.
- Google Trends data FAQChecked 2026-08-31
- How Google Trends Explore uses GeminiChecked 2026-08-31