

A business owner sees plenty of activity: website visits, form submissions, phone calls. Yet the calendar still has empty space. Buying more traffic might help. It might also make the same leak more expensive.
Your lead deficit is the gap between the qualified leads your plan requires and the qualified leads you currently expect. Calculating it forces three useful questions: how many new customers do you need, what share of qualified leads become customers, and where does the process break?
Start with a customer goal you can actually serve
Choose one period and one service or product group. A monthly target for one offer is easier to evaluate than a combined annual number covering unrelated services.
If you start from revenue, separate existing-customer revenue from the amount you expect new customers to contribute. Divide the new-customer revenue target by the expected revenue per new customer during the same period. Do not divide a monthly revenue gap by a lifetime customer value: those numbers describe different things.
Also check delivery capacity. A target requiring more work than you can fulfill needs a capacity decision before a marketing decision. Use your own records for revenue assumptions; the example below is arithmetic, not an industry benchmark.
Define a qualified lead before counting one
A qualified lead is a real potential buyer whose need fits your offer and service area. Your definition may also include timing or buying authority. Write it down so the denominator stays stable.
Exclude spam, duplicate submissions, job applications, vendor pitches and existing-customer support requests. Keep those contacts in appropriate systems, but do not call them new sales opportunities. If one person calls and fills out a form, your lead report should not automatically count two prospects.
Use a comparable group of leads with enough time to close. Leads created this week and customers won this week usually belong to different groups. Dividing them can produce a persuasive number that tells you little.
Use the lead deficit formula
- Close rate: customers won from a lead group divided by qualified leads in that group.
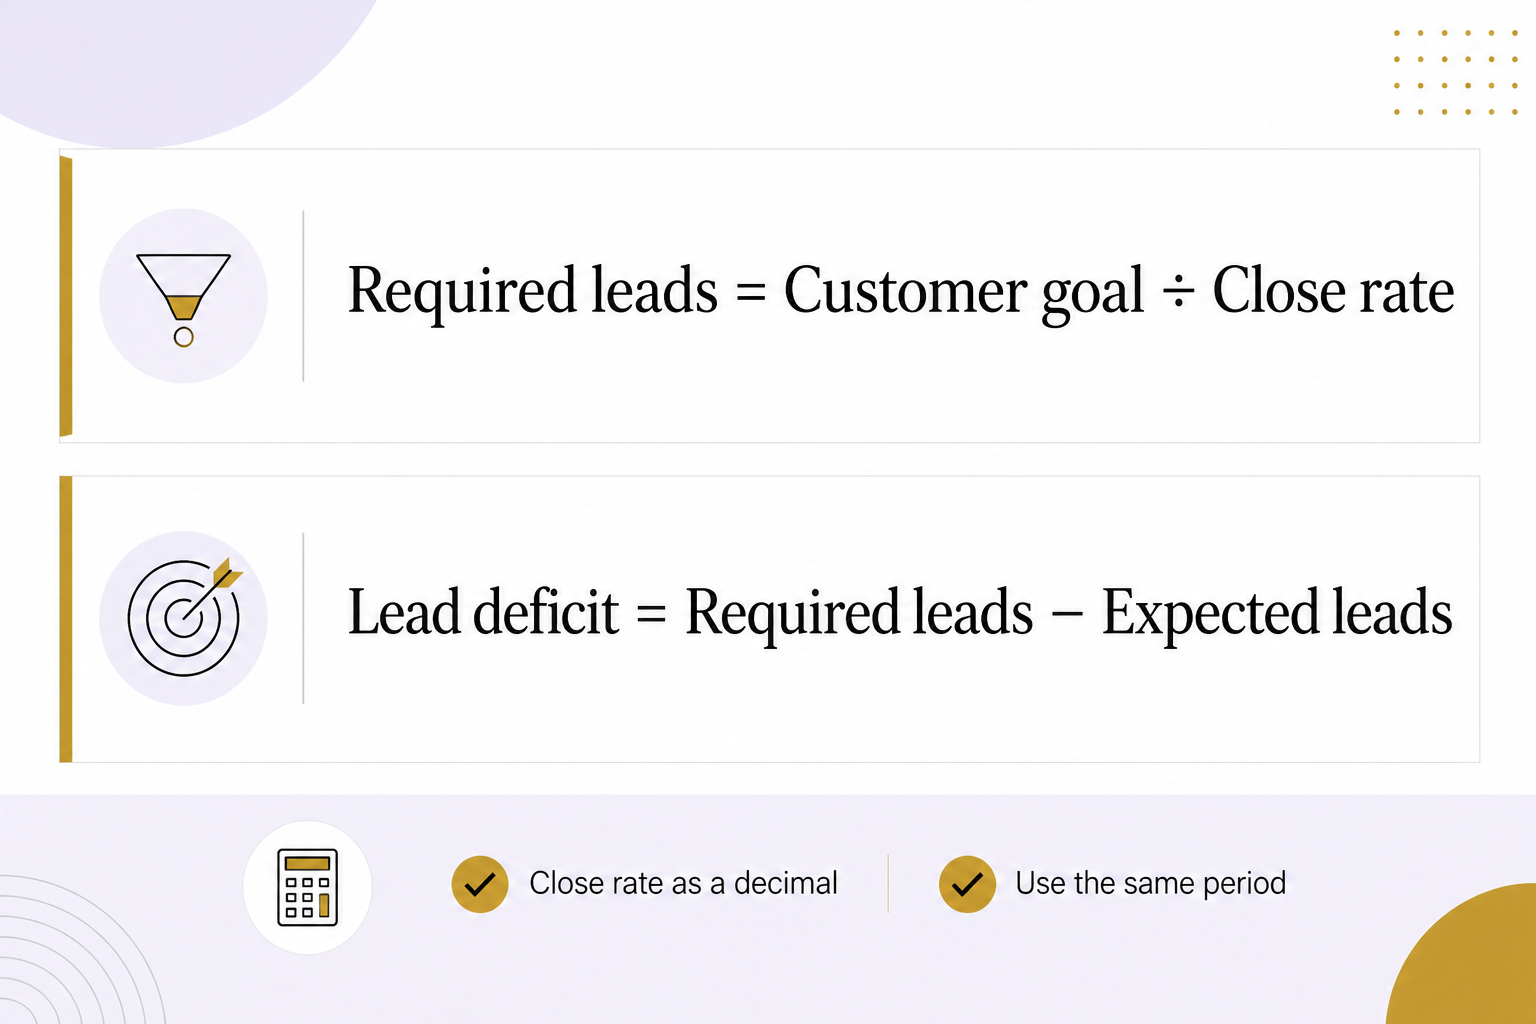
- Required qualified leads: target new customers divided by close rate, expressed as a decimal.
- Lead deficit: required qualified leads minus expected qualified leads.
Round the required lead count up to a whole lead. A negative deficit means your expected volume exceeds the calculated requirement; it does not guarantee the customer target. If the historical close rate is zero or unavailable, the formula cannot supply a reliable requirement. Improve the records or model explicitly labeled scenarios.
A hypothetical example
Suppose a business needs 12 new customers next month. Its comparable, matured lead group produced 10 customers from 50 qualified leads, a 20% close rate. Twelve divided by 0.20 equals 60 required qualified leads. If the business expects 40, its calculated deficit is 20.
Now test the assumption. At a 15% close rate it needs 80 leads, leaving a gap of 40. At 25% it needs 48, leaving a gap of eight. These are planning scenarios, not forecasts. They show why a small change in the sales process deserves attention before a large increase in advertising.
Use AI to investigate the gap
A connected assistant can help organize evidence. For example, HubSpot documents CRM and content assistance through Breeze, with access controlled by settings and permissions. HubSpot: Use Breeze Assistant
Give an approved assistant a minimized export with anonymous lead IDs, dates, source, qualification status, outcome and reason lost. Ask it to group stalled leads by reason and return the record IDs behind each group. Ask separately which fields are missing. Do not let it fill missing revenue or close dates with guesses.
Then inspect examples yourself. A label such as “price objection” may conceal a prospect who wanted a service you do not provide. A summary of lost opportunities cannot prove that a different message would have won those customers.
Choose the next action from the evidence
If inquiries are abundant but few qualify, tighten audience, offer and page language. If qualified leads wait unanswered, fix routing and follow-up. If proposals stall, review the questions buyers ask and what the proposal leaves unclear. If the process works but too few suitable people enter it, test an additional demand source.
Keep the first change small enough to interpret. Improving qualification and increasing advertising at the same time can make the next comparison hard to explain. Log the date, expected mechanism and outcome you will check.
Review the calculation as leads mature
Maintain a simple weekly view of qualified leads, customer outcomes, open opportunities and capacity. Recalculate when the sales cycle, offer or customer mix changes. Record missing information plainly instead of smoothing it into a confident dashboard.
If you want help connecting the lead calculation to your actual marketing and sales process, bring those records to an Eastmoor Digital discovery call.
Sources & further reading
Primary references checked for this refresh. Availability and platform behavior may change.
- HubSpot: Use Breeze AssistantChecked 2026-08-31