

Your website gets a disappointing speed score. The next move should not be installing three optimization plugins. First find out what the report measured, which part of the page is slow and whether the proposed fix affects something customers need.
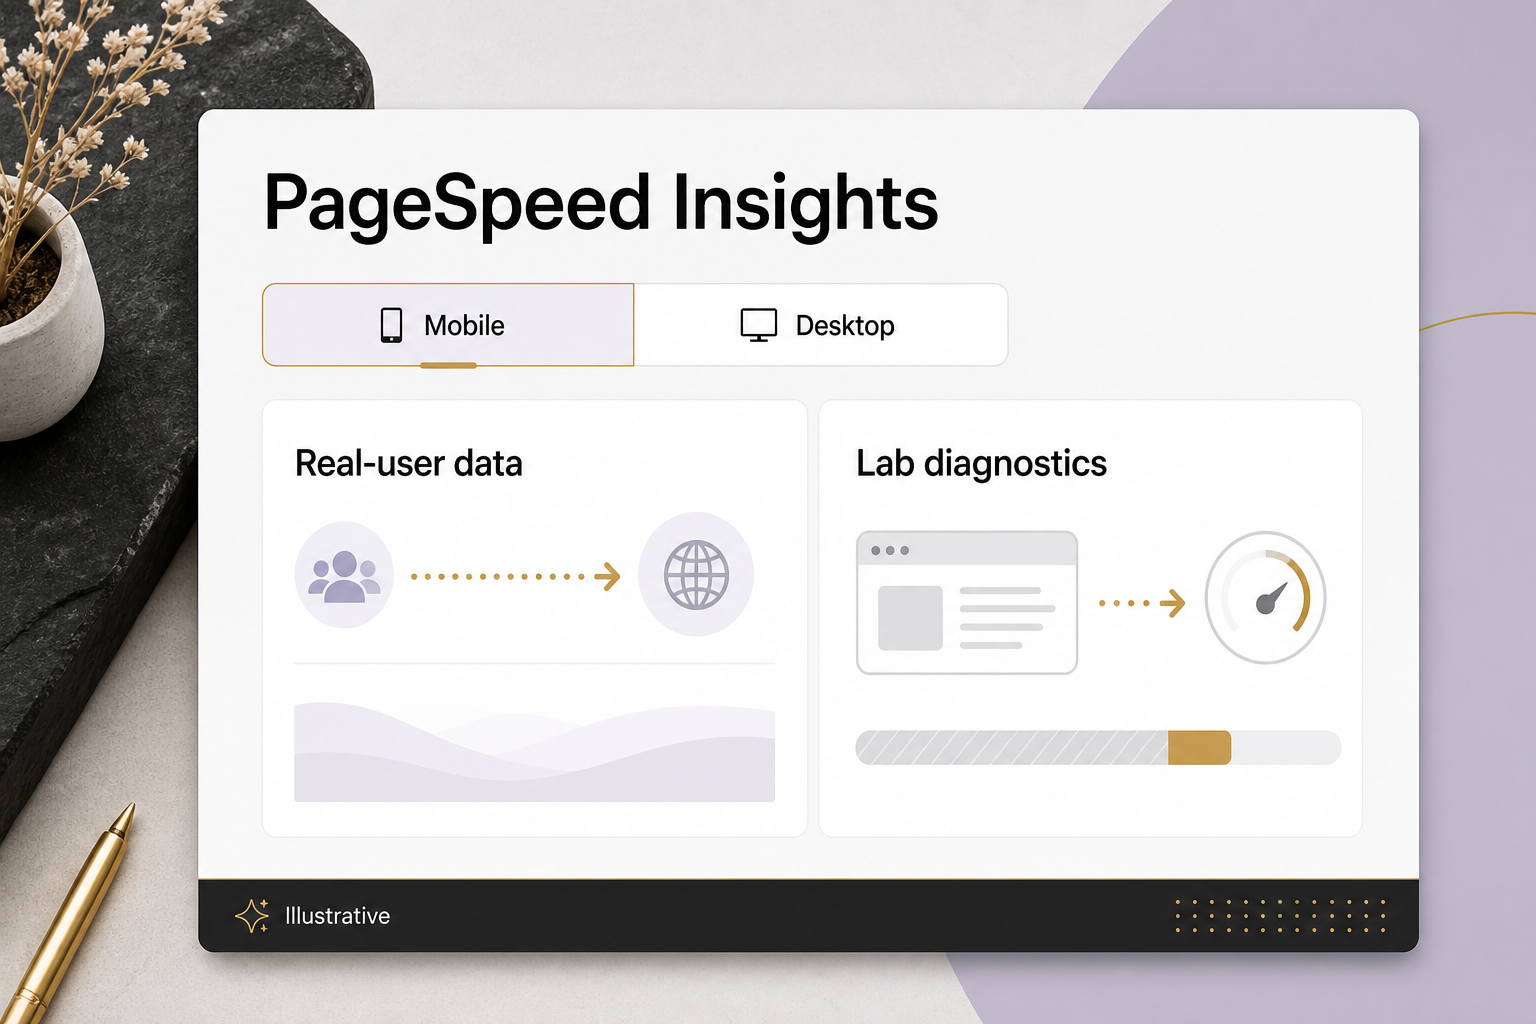
PageSpeed Insights combines different kinds of evidence. Google’s tool documentation distinguishes real-user field data from simulated lab tests. Those views answer different questions and can disagree without either being broken.
Read field and lab results separately
Field data reflects eligible real-user experiences over a reporting window. A lab run tests a particular load under specified conditions. Use field data to understand ongoing experience where available, and lab diagnostics to investigate possible causes.
If the report lacks enough field data, say so. A missing field result is not a pass. Also check whether displayed field data represents the specific URL or a broader origin.
Know the three Core Web Vitals
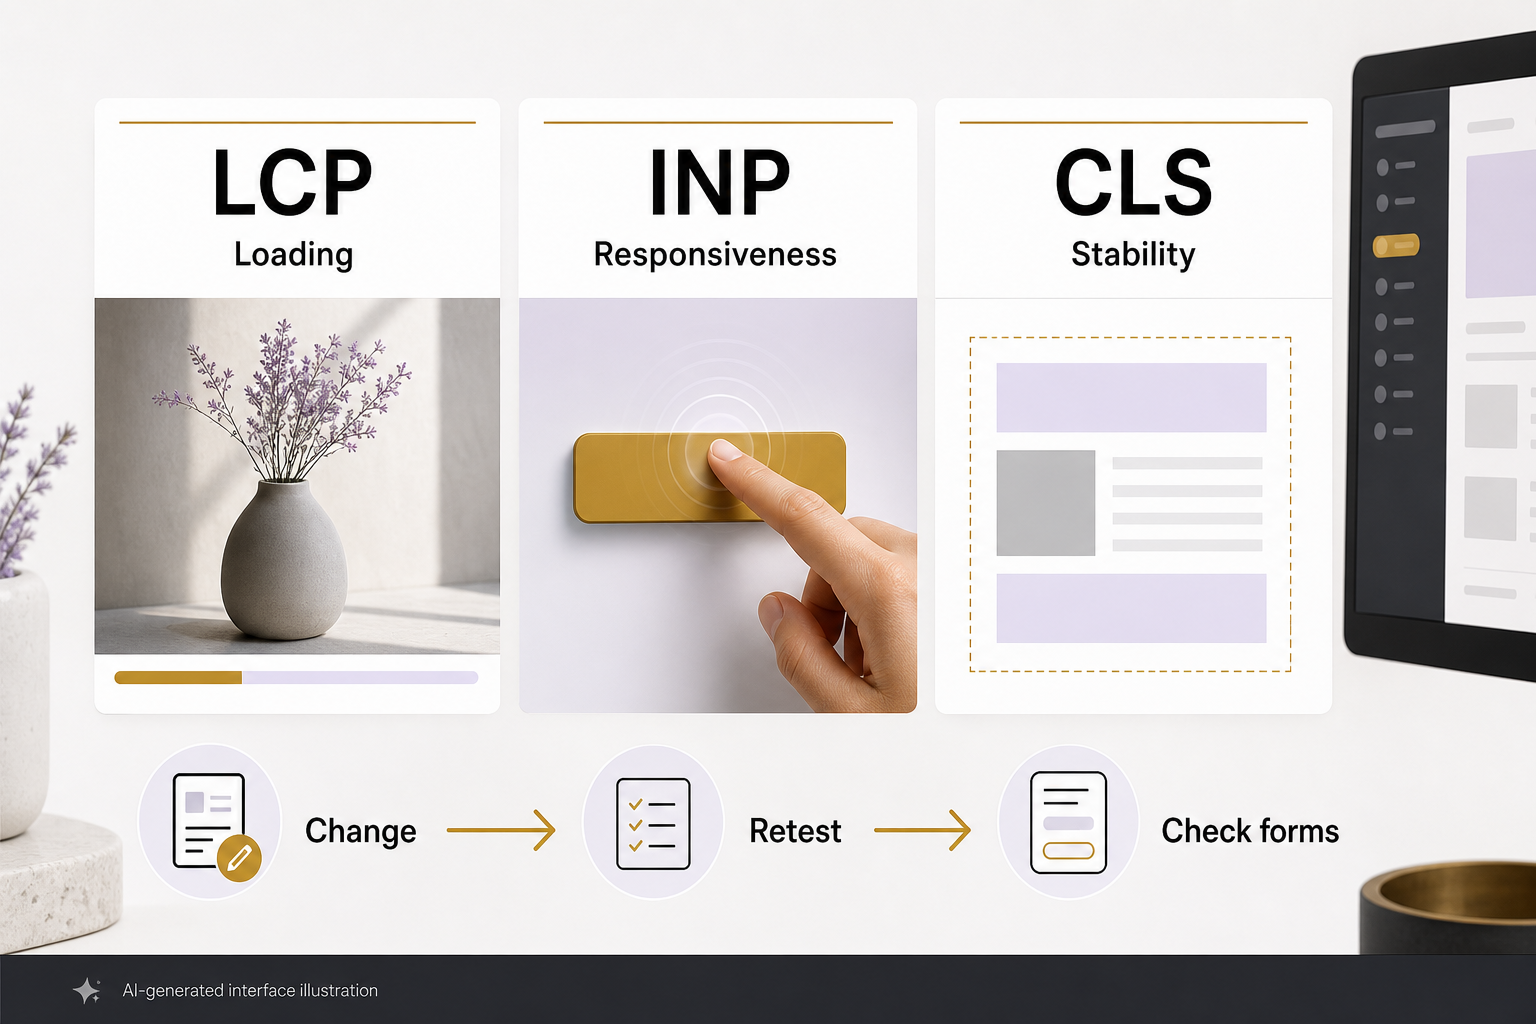
Current Core Web Vitals measure loading with LCP, responsiveness with INP and visual stability with CLS. Good field thresholds are LCP at or below 2.5 seconds, INP at or below 200 milliseconds and CLS at or below 0.1, evaluated at the 75th percentile.
Translate those into customer questions. Can the visitor see the main content promptly? Does a tap respond? Does the page move while they are trying to use it? A single Lighthouse score does not answer every part of that experience.
Investigate one bottleneck at a time
For slow main-content loading, identify the actual largest content element. It may be an image, text block or other visible element. Check its delivery and dependencies before compressing unrelated images.
For poor responsiveness, test real interactions such as opening navigation, entering a form and using filters. Inspect expensive scripts and unnecessary work. A page can load quickly but respond poorly after an AI chat widget or third-party tool becomes active.
For layout shifts, watch what moves. Images without reserved space, delayed banners and font changes are useful suspects. Record the observed cause rather than treating every visual movement as the same issue.
Ask AI to explain evidence, not guess
Give an approved tool a specific report excerpt and relevant code. Ask it to identify what the evidence supports, what remains uncertain and the smallest test that distinguishes possible causes.
Do not paste credentials, private customer data or an entire production configuration into an unapproved assistant. Do not apply a suggested caching rule without understanding whether it could cache personal pages or break forms.
A hypothetical recommendation to delay all JavaScript may improve a lab score while making the menu or booking button unresponsive. The correct review includes both performance and the working customer journey.
Use a controlled change process
- Save the baseline report, URL, date and test conditions.
- Back up the affected code or settings.
- Apply one justified change in a safe preview.
- Repeat the same diagnostic test.
- Test navigation, forms, checkout or booking as applicable.
- After release, watch field data over its reporting window.
Keep a rollback plan. If a faster page loses submissions or hides essential content, the change has failed regardless of the score.
Choose the next fix by customer impact
Prioritize the pages and interactions people actually use. A service landing page with a blocked contact path deserves attention before a low-traffic archive with a minor diagnostic warning.
Use scores as clues. Use evidence and completed tasks to decide whether the work helped. Talk with Eastmoor Digital about a performance review that includes the real experience.
Sources & further reading
Primary references checked for this refresh. Availability and platform behavior may change.
- Google: About PageSpeed InsightsChecked 2026-08-31
- web.dev: Web VitalsChecked 2026-08-31